Bus IQ Maximizer Log In

Maximize Every Mile

Find savings hiding in plain sight.

Helping school districts turn the data they already have into
savings opportunities they can see, validate, and act on.

Schedule a Demo

Keep your current systems. Start with the data you have today.

Maximum Insight.

Start with savings or operational health, then explore the trends, risks, opportunities, and scenarios shaping your transportation operation.

Select a starting point
bus-iq.com/financial-impact
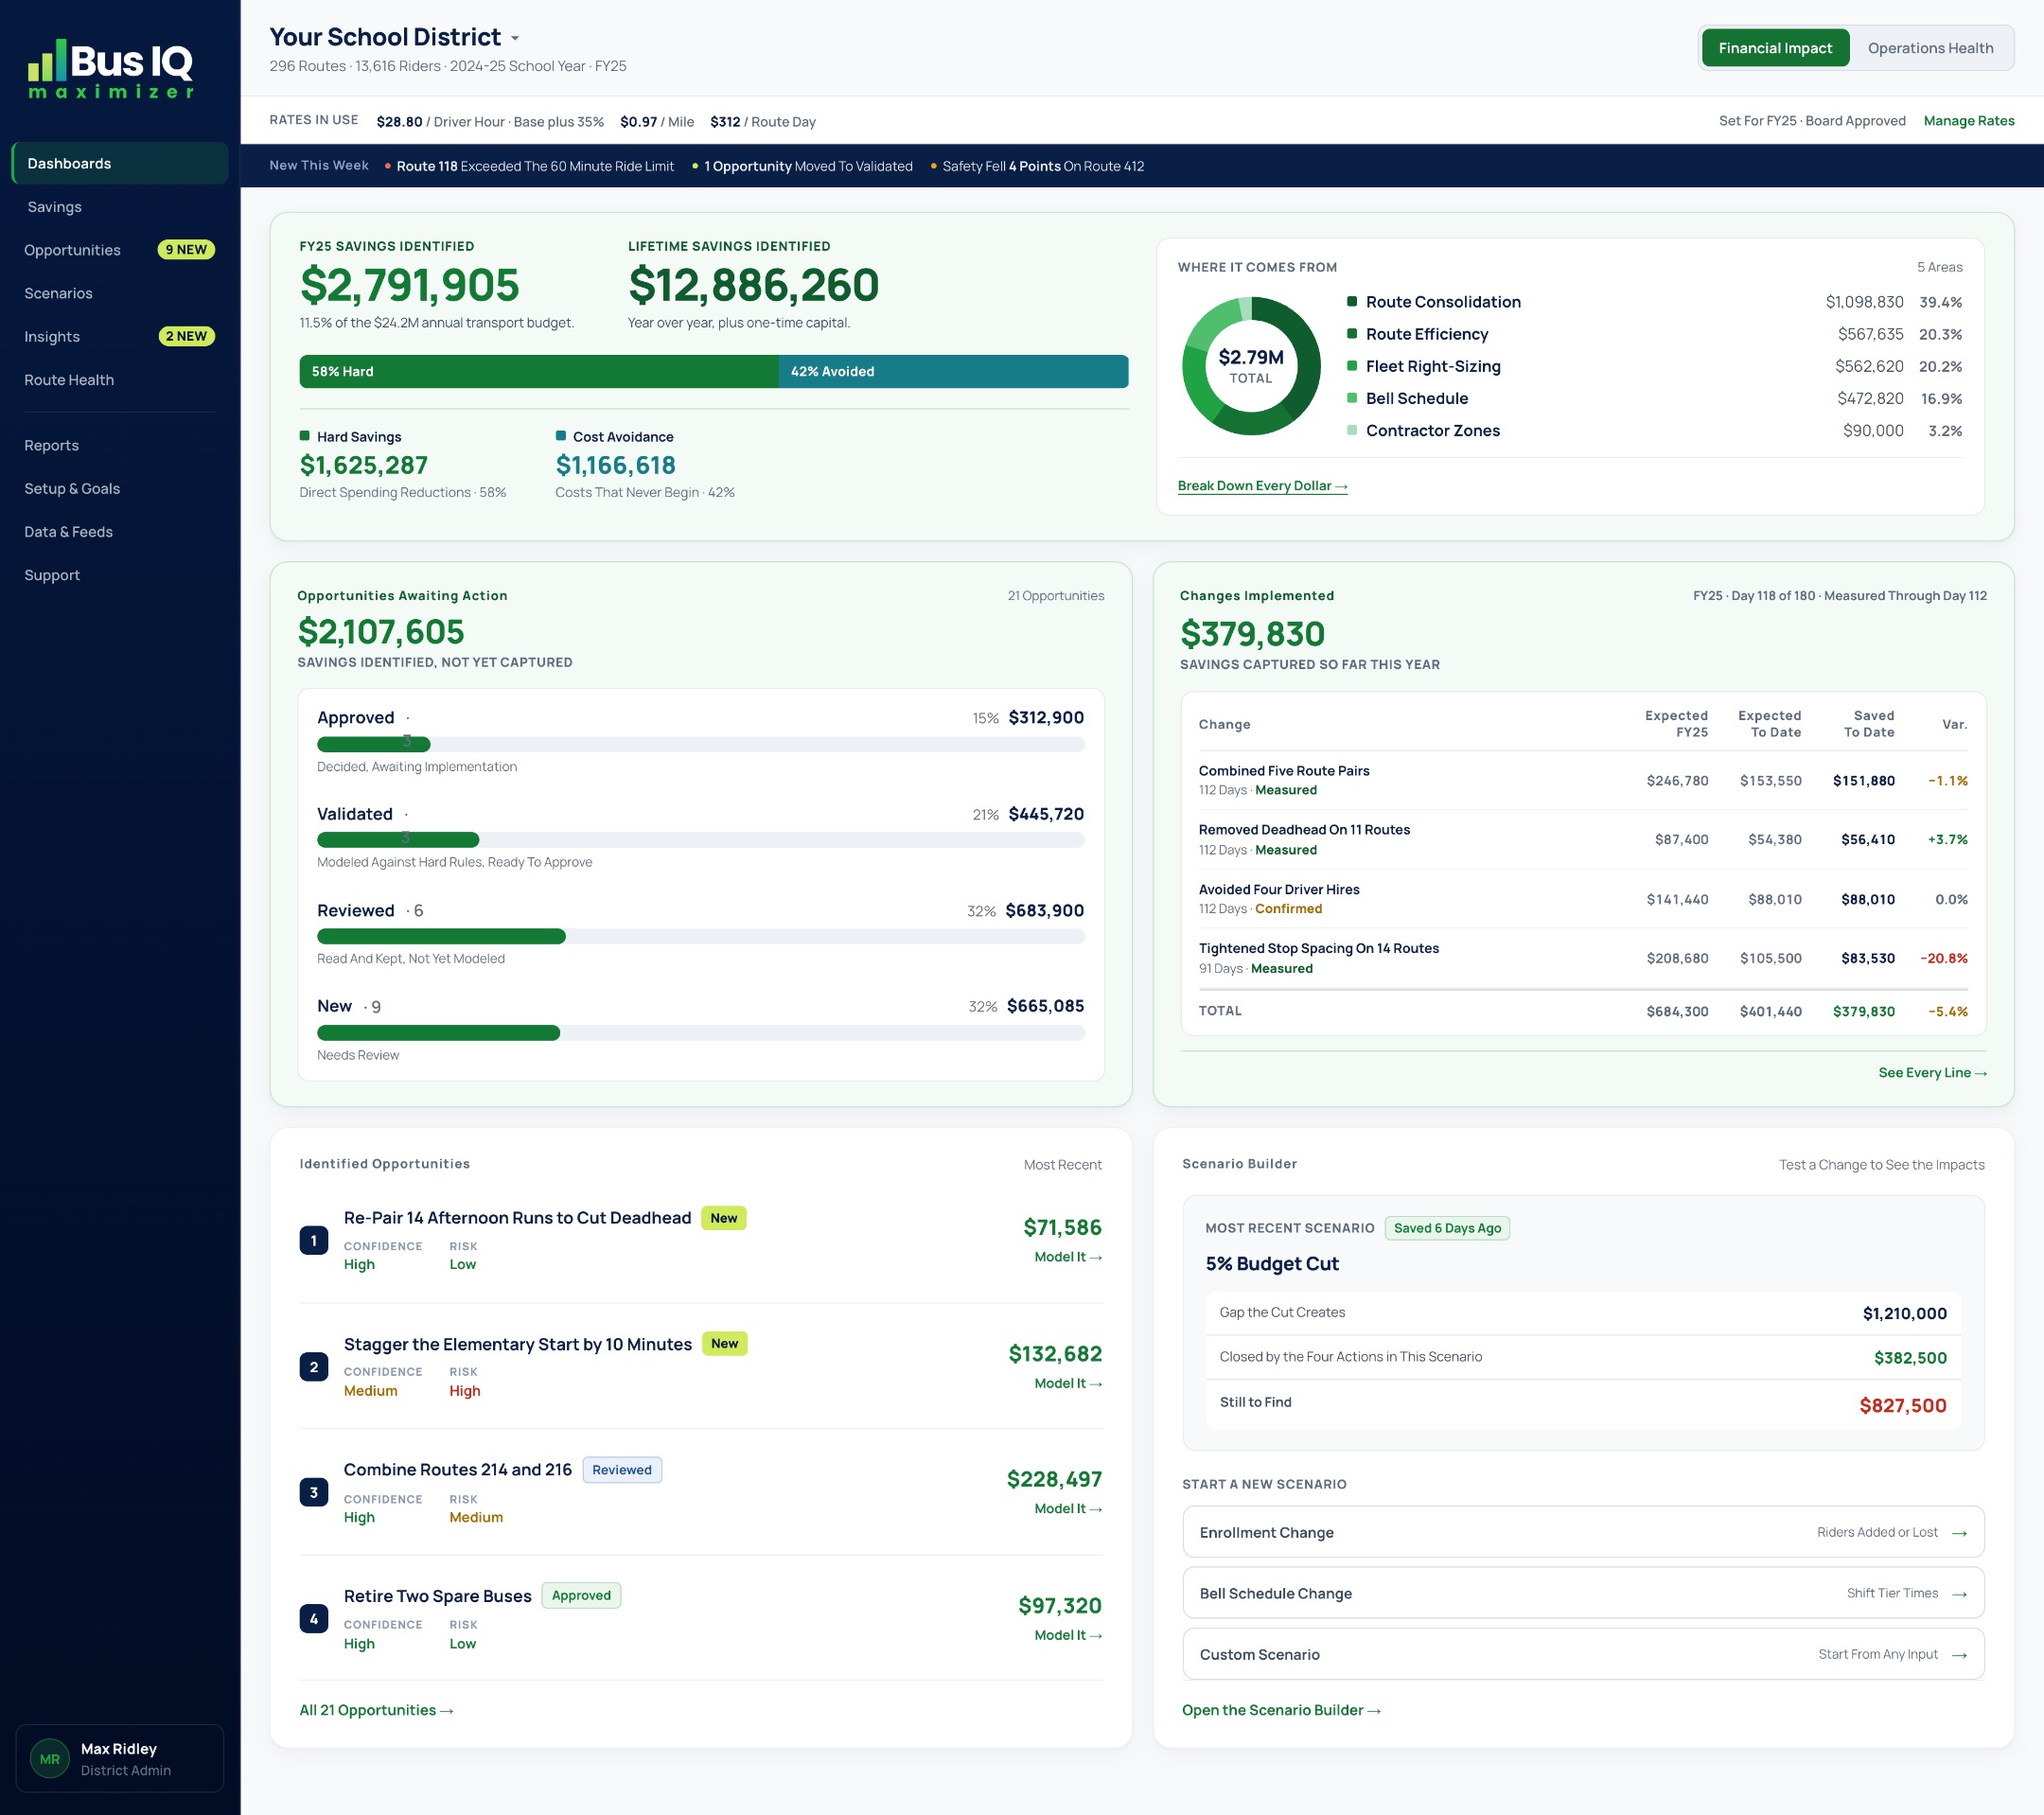
Financial Impact dashboard: savings identified, hard savings versus cost avoidance, opportunity pipeline, and scenario builder

What Maximizer Makes Visible

Savings, service, capacity, and readiness in one operating picture.

$2.79M
Identified, Annual
$1.63M Hard Savings $1.17M Cost Avoidance
Utilization Bell Schedules Fleet

Hidden Savings

Identify savings opportunities across utilization, bell schedules, fleet needs, and service design.

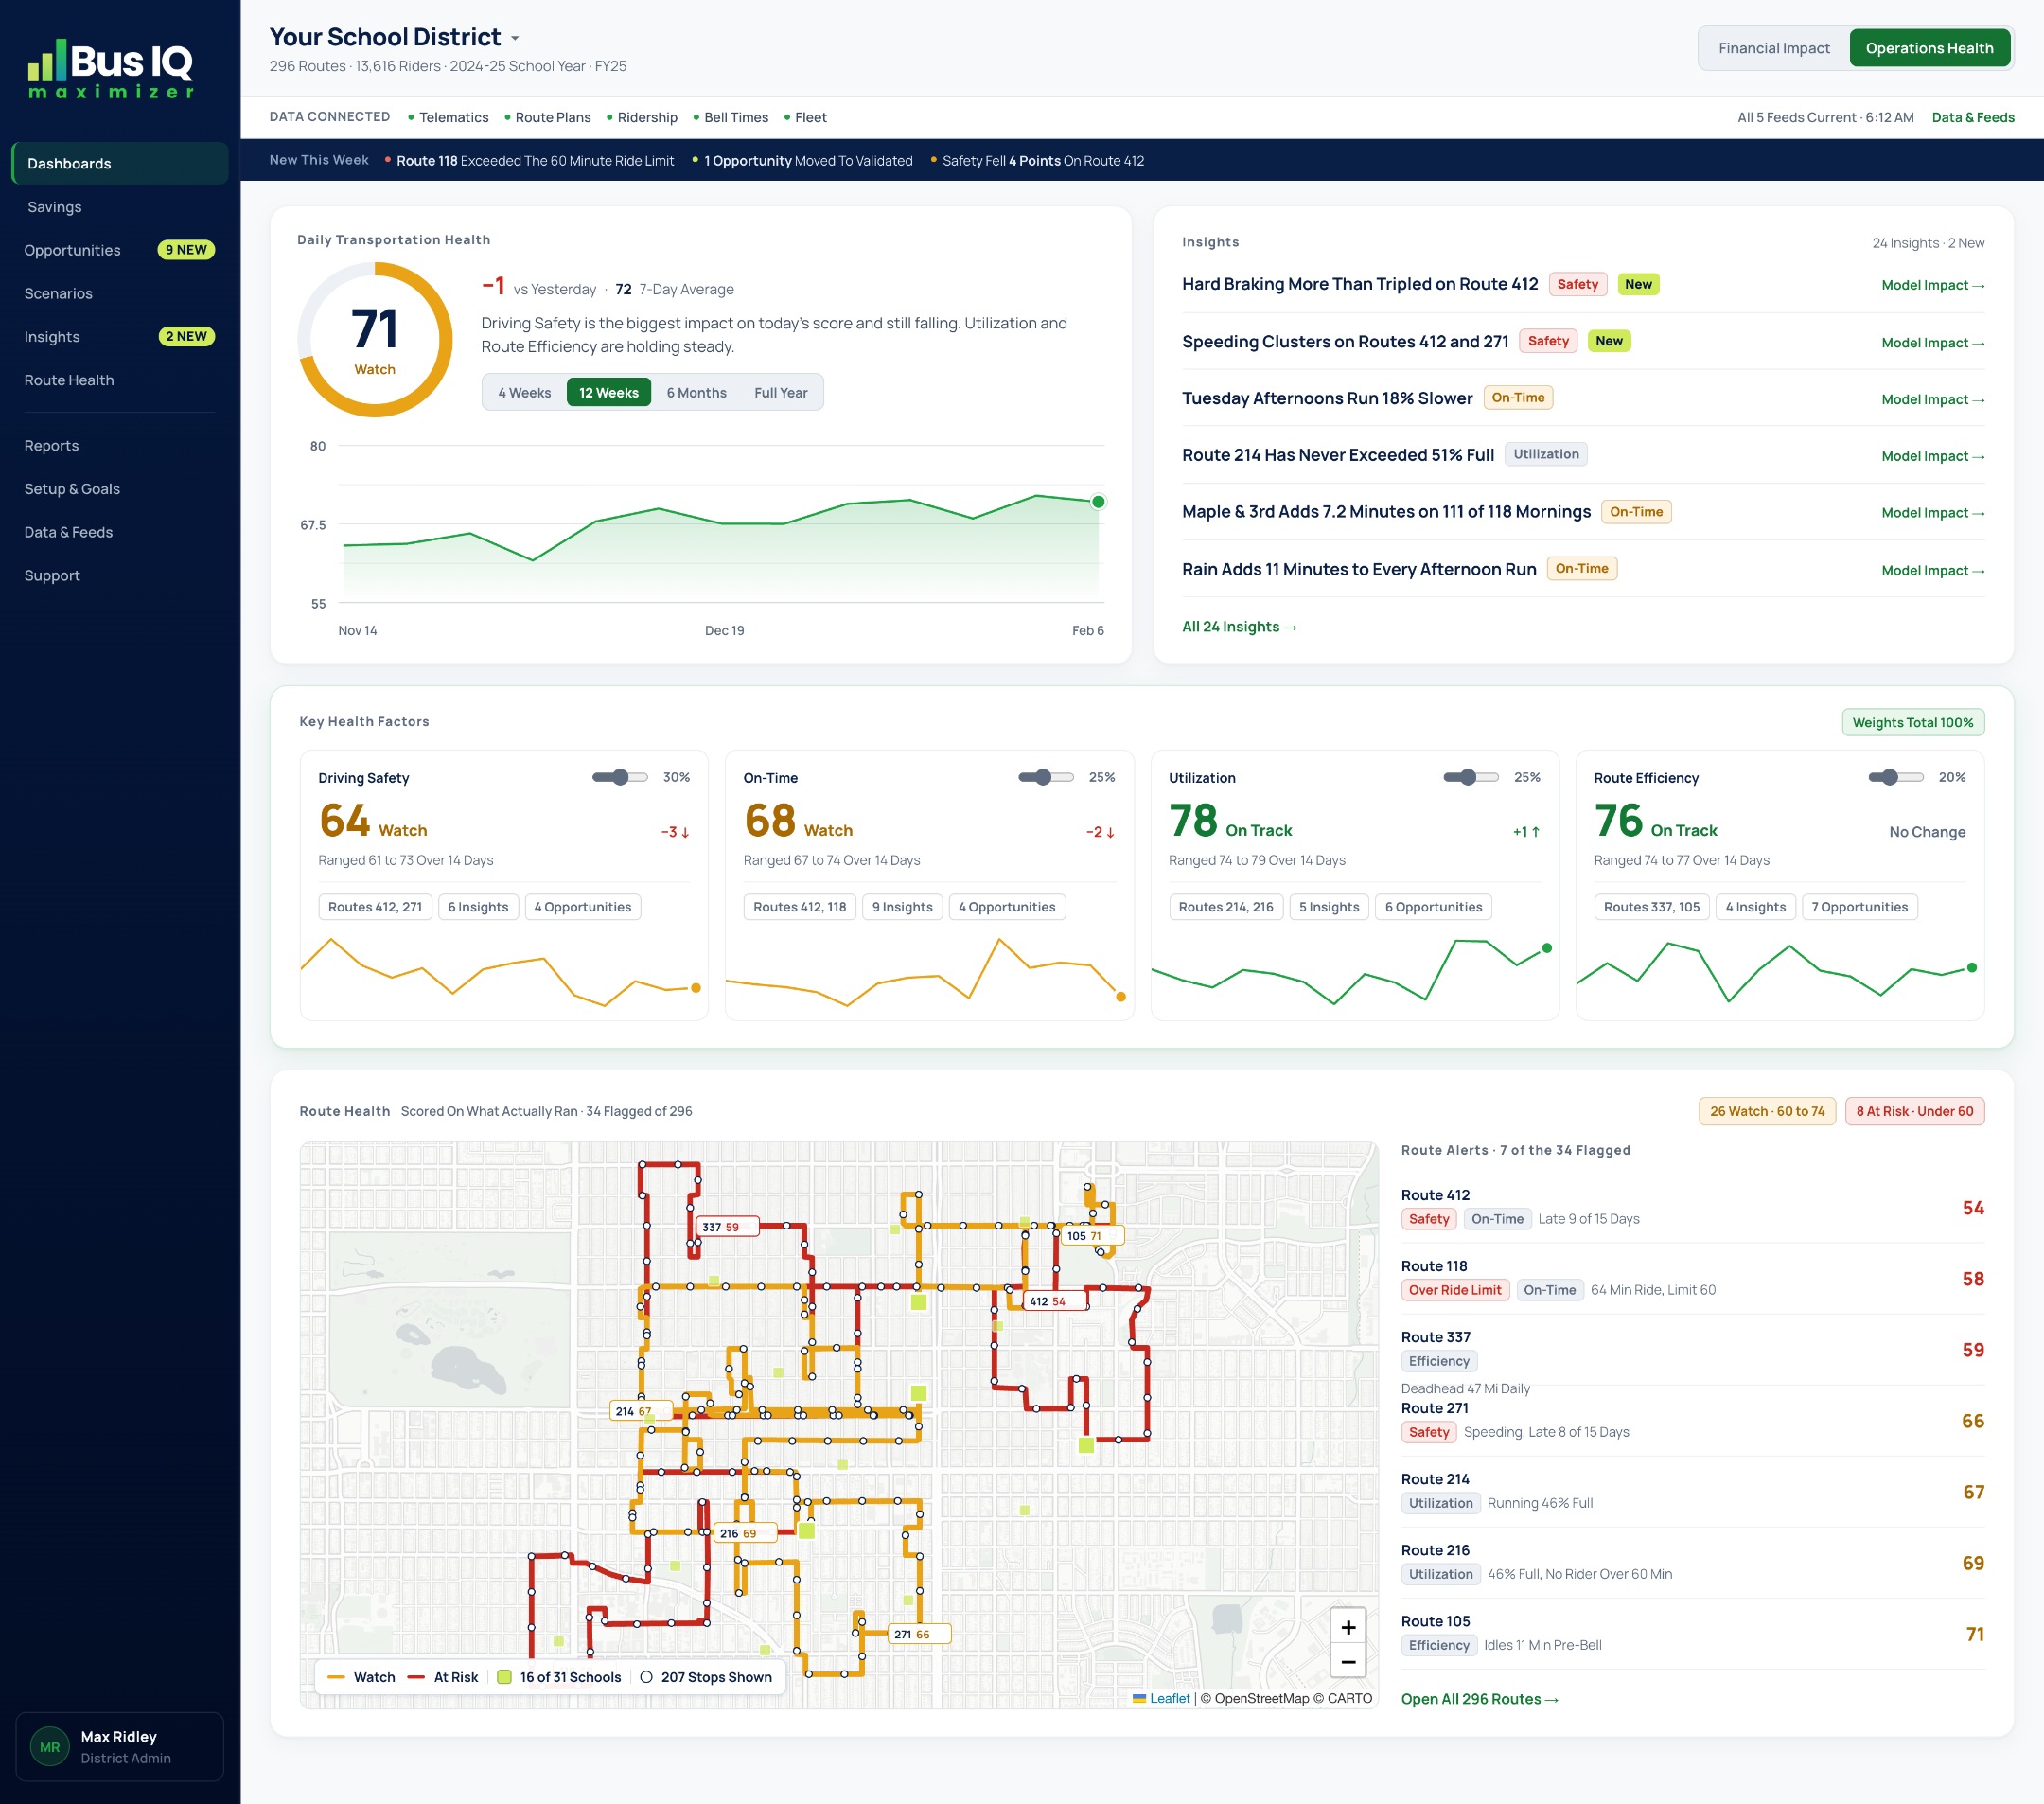
61 OF 100
▼ Slipping · 7-Day Trend
Service
Safety
Utilization
Readiness

Operational Drift

See when service, safety, utilization, or readiness starts slipping before it becomes a bigger problem.

Reduce Afternoon Deadhead
Value
$71,586
Risk
Low
Confidence
High
Affected
14 Routes
Next Step: Transportation Review

Decision-Ready Opportunities

Turn findings into cases with value, risk, confidence, assumptions, affected areas, and next steps attached.

Set Goal 5% Budget Cut
Model Options 4 Scenarios
Compare Impact Cost, Service, Risk
Check Fit Rules, Feasibility

Scenario Modeling

Set a goal in dollars, percent, or service impact, then compare ways to reach it before anything is implemented.

Allowed Within district limits
Flagged Below spare fleet target
Blocked Exceeds max ride time
Ride Time Capacity Accessibility Bells

Custom District Guardrails

Apply district-defined ride-time limits, capacity rules, accessibility needs, and bell windows before recommendations move forward.

Identified $1.52M
Approved $890K
Implemented $445K
Captured $379K

Defensible Results

Track what was estimated, approved, implemented, and captured so savings can be explained clearly and defended.

How Maximizer Works

Maximizer sits above the systems and data your district already has, using the sources you choose to create a clearer picture of the whole operation.

Select Data Sources
Connect one source or many.
Start with what you have.
Routing GPS & Telematics Ridership / RFID Bell Schedules Fleet Data Rates & Costs Spreadsheets Weather & Traffic
Bus IQ Maximizer
What Maximizer Runs
District Rules Baseline Modeling Savings Logic Scenario Workflow Confidence Scoring Impact Tracking
What It Produces
Savings & Opportunities Operational Health Modeled Options Measurable Results

Start with a spreadsheet export or secure import. Add more connections when ready.

Advance Beyond Better Routes

Route Optimization
Shorter Path
Better Sequence
School bus with an optimized route path
Improves the route.
Bus IQ Maximizer
Find
Savings Hiding in Existing Data
Model
Options Before Changes Are Made
Maximized school bus with glow accents
Validate
Rules, Service, Capacity, and Risk
Capture
Estimate
Approved
Realized
Maximizes the full operation.

One Platform. Driving Better Decisions.

Transportation decisions cross budgets, service, safety, and governance. Maximizer gives each role the information they need from a single operating picture.

Superintendents

Strategic Leadership
HEALTH SCORE 82

See the health of the transportation operation and the tradeoffs behind major decisions.

Business Officials & CFOs

Budget & Cost Control
IDENTIFIED SAVINGS $2.79M

Track savings opportunities, cost impact, and captured value in one view.

Transportation Teams

Operations & Service
REVIEW FIRST 3 Insights

Spot service gaps, operational health, and which changes should be reviewed first.

School Boards

Governance & Oversight
PROGRESS On Track

Review plain-language summaries, assumptions, and progress against stated goals.

Safety & Compliance

Student Wellbeing
RIDE TIME 51 / 60 min

Keep ride time, capacity, accessibility, and district rules visible before changes move forward.

Better decisions.
Better service.
Lower cost.

Each role sees what matters most, measured against the same goals.

Don't leave savings parked.
Maximize them.

Built for District Trust

Security tested. Data scope controlled. Decisions stay with your team.

AICPA SOC for Service Organizations
SOC 2 Type II Certified

Independently audited security controls that protect customer data, secure our systems, and support reliable service.

Your Data Stays in the U.S.

Customer data never leaves U.S.-based environments.

Pilot Without Student PII

Start with operational exports or selected feeds. No student PII required for pilot.

District Control Stays Intact

Maximizer surfaces opportunities and scenarios. Your team decides what moves forward.

Findings Stay Traceable

Inputs, assumptions, estimates, scenarios, and outcomes stay connected for review.

Backed by nearly two decades supporting mission-critical public-sector transportation software.

Questions School Districts Ask

Does it replace our routing software?

No. Maximizer works beside your routing, GPS, telematics, ridership, fleet, and cost systems. It turns those inputs into scores, insights, and scenarios you can act on.

Is this a bus tracking app?

No. Telematics can feed Maximizer, but the product is not a parent-facing live bus map. The output is operational and financial intelligence for district decisions.

What does a district need to start?

Start with the data you already have: routing, ridership, fleet, cost, bell schedule, or service data. Exports are enough to begin; API feeds can come later. Maximizer can also connect directly to sources like weather, traffic, and telematics, so those signals arrive without extra work from your team.

How are savings estimates calculated?

Bus IQ’s proprietary savings methodology draws on two decades of real-world work across public-sector transportation, corporate finance, and advanced data science. That work includes initiatives tied to more than $50M in savings and cost avoidance. Opportunities are measured against your district baseline, cost structure, utilization, service rules, and operating trends, then tracked from estimate to captured value.

Does this cut driver jobs?

No. Most school districts are short drivers, not overstaffed. Savings come from miles, utilization, spare capacity, overtime, service design, and contracts rather than headcount. If a scenario affects staffing, Maximizer shows that clearly before anything moves forward.

How long does a pilot last?

A focused pilot is designed to run in 30 days after data handoff, and much of it can run on historical data you already have. The process is straightforward: collect available data, establish your baseline, identify opportunities, and review modeled findings.

Ready to See What Your Data Can Unlock?

Schedule a focused demo tailored to your district’s goals, systems, and data.

Works with your current systems.
See a full demo with synthetic data first.
Qualified districts can start with a no-cost pilot.

Have Questions Before Scheduling?

Ask about fit, data needs, pricing, pilots, or how Maximizer would work with your current systems.